Introduction
In this blog post, I share my technical experience from two significant projects I worked on as part of the Business Intelligence team at Meta. These projects represent some of the complex challenges we faced and the innovative solutions we developed. By exploring these projects, I hope to provide insights into the kind of work I do and offer valuable knowledge to anyone interested in engineering and business intelligence.
Project I: Revenue Pipeline Migration from Oracle to Vertica
Background
After completing Facebook’s intensive six-week bootcamp, I was eager to start my first project. The assignment was both challenging and crucial: to develop the revenue pipelines that the accounting team relied on every month. This wasn’t just about processing numbers; these figures were critical to the company’s financial reporting and earnings calls, which were closely monitored by stakeholders and investors.
Working with the business intelligence team, I had to ensure that sensitive financial data was handled securely, following a strict non-disclosure agreement. At the same time, Facebook was transitioning from Oracle to Vertica, a high-performance analytics platform designed for complex queries and business intelligence. My first task was to migrate the revenue pipeline from Oracle to Vertica, ensuring accuracy and reliability throughout the process.
Given the critical role these pipelines played in the company’s financial ecosystem, there was no room for error. The migration required meticulous planning, rigorous testing, and close collaboration with various teams to ensure a seamless transition without impacting ongoing operations. It was a high-stakes project that set the tone for my journey at Meta’s business intelligence team.
Design and Approach
The migration of the pipelines from Oracle to Vertica required meticulous planning and attention to detail. Data accuracy was critical, as was time sensitivity, given the monthly revenue close process’s tight timelines. To ensure a smooth transition, I approached the task in three distinct phases:
- Phase 1: Initial Migration and Testing
The first step involved migrating the existing code from Oracle to Vertica and running it with minimal or no changes. This allowed me to verify that the basic functionality was intact and to get familiar with the business logic driving the pipelines. By observing how the code behaved in Vertica, I identified any compatibility issues and ensured a stable foundation for further development.
- Phase 2: Query Optimization and Error Handling
With a clearer understanding of the business logic, I began analyzing the larger, more complex queries to identify opportunities for optimization. By breaking down these queries into smaller tasks, I was able to create processes that were faster to run and would fail sooner, allowing for quicker error detection and easier debugging. This phase was critical for reducing the time and effort required to identify and fix issues during the monthly close.
- Phase 3: Integration with DataSwarm
Once the optimized logic was tested and validated, the final phase involved integrating the pipeline into DataSwarm, Facebook’s in-house data orchestration framework. This step ensured that the new process was fully aligned with the company’s data infrastructure and could be automated for consistent performance during revenue close cycles.
By following this structured approach, I was able to ensure a smooth and efficient migration, significantly improving the reliability and efficiency of the revenue pipeline.
Integration Into Dataswarm
Facebook’s internal data scheduling tool, DataSwarm, was central to orchestrating and monitoring our pipelines during the migration process. This Python-based framework, which served as a predecessor to Apache Airflow, offered a range of powerful features for pipeline management and data orchestration. Some of its key capabilities included:
- Quick Error Detection: DataSwarm made it easy to identify failing tasks and locate the corresponding logs, enabling rapid debugging and resolution.
- Backfill Support: This feature allowed us to rerun pipelines to address data gaps, ensuring continuity and accuracy.
- Upstream Dependency Navigation: DataSwarm enabled us to identify and resolve upstream blockers, streamlining the flow of data through the pipeline.
- Data Quality Monitoring: We set up quality checks to monitor data integrity, helping to maintain high standards throughout the process.
- Task Monitoring: The tool provided insights into in-flight tasks and allowed us to analyze historic performance, aiding in capacity planning and optimization.
These features were crucial in maintaining a robust pipeline system that met strict Service Level Agreements (SLAs) while ensuring data accuracy and compliance with regulatory requirements.
After successfully testing a single run and validating the data, we integrated the logic into DataSwarm and scheduled it to run every month following the revenue close process. This orchestration approach helped automate critical tasks, providing a consistent and reliable workflow.
Below is an example of Airflow code which is very similar to DataSwarm code that demonstrates how the scheduling and monitoring were set up in the project.
|
This code snippet illustrates how a typical DAG (Directed Acyclic Graph) is structured to orchestrate data processing tasks within DataSwarm (or Apache Airflow). By incorporating these features, we ensured a smooth, reliable, and automated data orchestration process for our project.
Addressing Technical Challenges
The migration from Oracle to Vertica presented several technical challenges that required careful planning and problem-solving:
1. Tackling Data Sensitivity
One of the most significant challenges was ensuring data sensitivity and limiting access to sensitive financial information. Given the confidential nature of the data involved in revenue pipelines, we implemented strict access controls. Special measures were taken to make the data and associated dashboards accessible only to authorized personnel.
- Controlled Partitions: The source data tables were vast, necessitating initial aggregation in general partitions. We calculated product allocations and other preliminary metrics in these general partitions. Only the summarized and consolidated data was then moved to a highly restricted partition, used exclusively by the finance team. This separation helped maintain data security and prevented unauthorized access.
- High Priority Processing: Data administrators gave this process the highest priority in the processing queues to ensure swift handling of sensitive data. This helped make critical information available to stakeholders as soon as possible, reducing delays in the monthly revenue close process.
2. Ensuring Data Quality
Data quality was another critical aspect, given the importance of accurate revenue reporting. We implemented several measures to ensure that the data remained accurate throughout the migration process:
- Partition Validation: We verified that all data partitions were populated correctly and that no data was lost during the migration.
- Revenue Reconciliation: We ensured that the final revenue figures matched expected values, performing checks to confirm that product splits and other calculations were correct. This reconciliation process reduced the risk of discrepancies in financial reporting.
3. Managing Syntax Differences
Oracle and Vertica have different query syntaxes, which required a learning curve to adapt to Vertica’s requirements. This challenge impacted both the migration process and ongoing maintenance:
- Syntax Adjustments: We had to refactor the original Oracle code to work with Vertica’s syntax. This included adapting SQL queries and rethinking certain business logic elements to ensure compatibility.
- Testing and Validation: Each refactored query underwent rigorous testing to confirm that it produced the correct results and met performance expectations.
4. Breaking Down Large Queries
The original Oracle script was monolithic, taking approximately eight hours to execute. A failure at any point meant restarting the entire process, leading to delays and inefficiencies. To address this:
- Segmented Queries: I broke the original query into four distinct steps, which reduced processing time and allowed for data validation at each stage. This modular approach also facilitated quicker error detection and resolution.
- Transitioning to Presto: Due to performance issues with Vertica, we eventually migrated to Presto, which provided better handling of large datasets and complex analytical queries. This shift required additional adjustments but resulted in a more robust and efficient pipeline.
These challenges required a combination of technical expertise, problem-solving skills, and collaboration across teams to ensure a successful migration and reliable revenue pipeline.
Results and Impact
After completing the project, the migration of all pipelines from Oracle to Vertica was successful, with significant improvements in processing times and operational efficiency. Here are the key outcomes:
- Reduced Processing Times: By transitioning to Vertica, we cut the pipeline processing times by half, allowing us to complete the monthly revenue close process more quickly and efficiently. This improvement reduced the burden on the accounting team and provided more flexibility in handling complex data operations.
- Priority Queues for Sensitive Data: Vertica’s priority queues allowed us to prioritize processing for the most time-sensitive data. This capability ensured that critical tasks were completed first, reducing the risk of delays in revenue reporting and improving overall reliability.
- Streamlined Data Orchestration with DataSwarm: Using DataSwarm as our data orchestration tool brought additional benefits. We could delegate operational tasks to the operations team, who were responsible for ensuring that upstream jobs and tasks completed on time. This separation of responsibilities allowed for smoother workflow management and quicker response times in case of pipeline issues. Additionally, it enabled engineers to focus on development without being bogged down by operational details.
- Improved Data Quality and Accuracy: With the enhanced pipeline structure and data quality checks, we experienced fewer errors and inconsistencies. This resulted in more accurate revenue figures, reducing the risk of discrepancies during financial reporting.
- Enhanced Collaboration and Team Efficiency: The new pipeline setup and DataSwarm integration facilitated better collaboration among teams. With the operations team handling orchestration and monitoring, engineers were free to focus on developing and optimizing pipelines. This division of labor contributed to a more efficient workflow and improved productivity.
Overall, the successful migration to Vertica and the use of DataSwarm as a data orchestration framework had a significant impact on our business intelligence processes. It not only improved the speed and reliability of revenue data processing but also provided a more scalable and flexible foundation for future growth and adaptation.
Project II: Implementing Financial Forecasting
Background
After establishing the monthly revenue close process, our team sought to find ways to leverage the data for broader business insights. We realized that providing more frequent revenue updates would offer significant value to management, enabling them to make timely decisions based on real-time data. This led to the development of a dashboard that presented daily revenue metrics and a financial forecast to support strategic planning and operational efficiency.
The new dashboard allowed management to track revenue progress against daily, monthly, and yearly targets, providing a clear view of the company’s financial health at any given moment. To enhance its accuracy and relevance, we integrated regression models that accounted for seasonal variations, historical trends, and external factors that could impact revenue, such as market fluctuations or economic conditions.
This level of granularity enabled the management team to delve deeper into individual product performance, facilitating more informed decision-making. They could identify trends, spot outliers, and compare actual revenue against projections, allowing them to adjust strategies as needed. With this data-driven approach, management could respond quickly to emerging opportunities or potential challenges, ensuring the company’s continued growth and competitiveness.
Design and Approach
After building the revenue pipelines for the monthly close process, we had a solid foundation of data at the monthly level. To provide more granular insights, we decided to build a pipeline that would capture data on a daily basis and apply product-specific breakdowns.
The design focused on creating a pipeline that would feed daily revenue data into a Tableau dashboard. This dashboard could then perform complex aggregations and run a regression model to compare actual revenue against forecasted goals. The dashboard offered multiple views, allowing users to analyze revenue at daily, weekly, and monthly levels, and to break down revenue by product type.
To achieve this, we needed a flexible and scalable pipeline architecture. Here’s how we approached it:
- Daily Data Collection: We set up a new pipeline to capture and process daily revenue data. This involved refining our data extraction process to ensure that it captured all relevant information, including product-level details.
- Data Aggregation and Regression Analysis: The pipeline processed the raw data, performing initial aggregations to create summary statistics that could be used in the Tableau dashboard. We also integrated a regression model to analyze revenue trends and account for factors like seasonality, allowing for more accurate financial forecasting.
- Secure Access and Data Sensitivity: Given the sensitive nature of the revenue data, we implemented strict access controls. We restricted access to only a select few within the company who needed it, ensuring compliance with data privacy policies and minimizing the risk of data leaks.
- Dashboard Integration: The final output of the pipeline was fed into Tableau, where we designed a comprehensive dashboard. The dashboard provided key metrics and visualizations that allowed the finance team to monitor revenue progress against targets. Users could drill down into specific product categories or view broader trends to inform strategic decisions.
Despite the similarities with the previous project, this new pipeline introduced additional complexities due to the higher frequency of data collection and the need for real-time analysis. By building a robust and secure system, we ensured that the finance team could access accurate and timely information to guide business decisions.
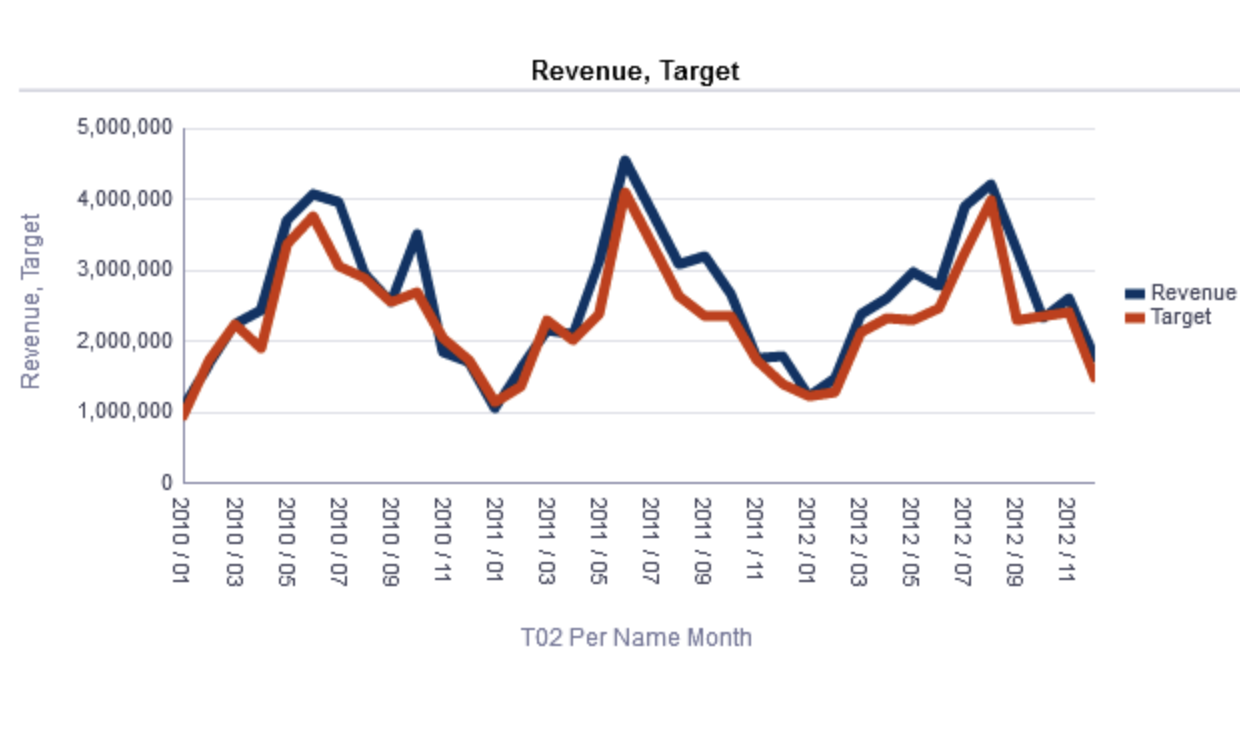
Image Disclaimer: The sample chart used for illustration. The data shown is not accurate and is not intended to represent real information. Please do not use this chart for analysis or decision-making.
Results and Impact
The dashboard became an indispensable tool for executives, including Susan Li, Meta’s current Chief Financial Officer. It provided detailed insights that guided a range of critical business decisions, shaping the company’s strategic direction.
- Real-Time Business Intelligence: The dashboard offered real-time updates on revenue metrics, enabling executives to make informed decisions based on current data. This responsiveness was crucial for a dynamic company like Meta, where market trends and business priorities could shift quickly.
- Product Performance Analysis: Executives used the dashboard to evaluate individual product performance, identifying which products were driving revenue growth and which ones needed more attention. This detailed breakdown helped the company allocate resources effectively and prioritize product development and marketing efforts.
- Strategic Planning and Forecasting: The dashboard’s integration of regression models and financial forecasts provided valuable insights for long-term planning. It allowed executives to anticipate revenue trends, factor in seasonal variations, and set realistic goals. This informed approach contributed to more effective strategic planning at the highest levels of the company.
- Enhanced Collaboration and Transparency: The dashboard facilitated better communication among executives and across teams. Its intuitive design and comprehensive metrics made it easy for stakeholders to understand revenue trends and align their strategies accordingly. This increased transparency fostered a collaborative environment, driving collective decision-making.
Overall, the dashboard became a central resource for Meta’s leadership, providing the insights needed to steer the company towards sustained growth. Its impact extended beyond revenue tracking, influencing broader strategic decisions and fostering a data-driven culture throughout the organization.
Conclusion
The journey from Oracle to Vertica and eventually to Presto was filled with valuable lessons and achievements. The migration to Presto allowed for greater speed and performance, demonstrating the importance of adaptability in data engineering. These transitions underscored the need for flexible pipeline designs that can evolve with technology and business requirements.
One of the most significant takeaways from these projects was the importance of building scalable and adaptable pipelines. As technology continues to advance, the ability to migrate from one platform to another without major disruptions is crucial. This flexibility ensures that business intelligence processes can keep pace with changing needs and emerging tools.
Additionally, these projects illustrated the value of extending solutions to multiple business use cases. By building robust data pipelines and dashboards, we were able to deliver insights that impacted both day-to-day operations and strategic decision-making at Meta. This approach not only increased efficiency but also provided the company with a more comprehensive view of its business landscape.
As we continue to innovate and adapt to new technologies, the lessons learned from these projects will guide us in building more resilient and scalable data solutions.
Thank you for taking the time to read about my experience. I’d love to hear your comments or questions below. Feel free to share your thoughts and feedback—I look forward to continuing the conversation with you.
Additional Resources
To further explore the concepts and tools discussed in this blog post, I’ve gathered a few resources that provide additional insights into data orchestration, pipeline management, and the platforms mentioned:
- Dataswarm Overview: YouTube Video
- A brief introduction to Dataswarm, highlighting its key features and benefits.
- Vertica Documentation: Vertica Knowledge Base
- The official Vertica documentation, offering comprehensive information on setup, best practices, and advanced features.
- Presto Documentation: Presto Documentation
- Learn more about Presto, including its architecture, usage, and community resources.
- Apache Airflow Resources: Apache Airflow Documentation
- Since Dataswarm is based on Apache Airflow, this documentation provides additional context on workflow orchestration and DAG (Directed Acyclic Graph) design.
These resources should help you explore the topics discussed in this blog post in greater depth.